
Who you sit next to, and why it matters
A network analysis approach to the work-life in the post pandemic office.
 21 December 2021
 6 min.
Introduction: spaces and data in a hybrid working context
Reality can be physical or virtual (or both at the same time), and people are able to dose work needs by balancing the two dimensions: this is the reason why all over the world employees are asking for a higher degree of freedom in managing their own life between the office (the physical reality of work) and the remote working (the virtual reality of work). The research question is how collaboration, communication and innovation dynamics change in a fully-free Smart Working world.
As stated by OpenKnowledge’s CEO Rosario Sica in the last HBR Italia attachment curated by OpenKnowlege, Nowadays there is a dynamic balance characterizing workspaces, which are in a transformation phase from spaces to places. […] While spaces are the sites where we live and work, places are those where we feel we belong. A place is made of relationships, it is a social dimension in which employees’ well-being is truly put at the center […] Technologies and data can help to escape from the organizational pulverization which remote working […] has brought, identifying tacit communities within an organization and supporting free connections among employees.(Sica,, 2021)
In this article, the interactions between people in the office are investigated by using the huge amount of data provided by remote-working tools (in this case, the desk-reservation tool data): in fact, OpenKnowledge, being part of BIP Group, undertook a transformational path leading to a fully-free smart working firm.
Experiment description and data model framing
Currently, in BIP Group, employees attending the office are required to make a mandatory reservation of the workstation: as stated before, this policy has produced a wonderfully large amount of data about where colleagues sit.
We analyzed only data related to OpenKnowledge (approximately 100 people), between September and November 2021. This analysis aims at understanding collaboration and knowledge flows happening in shared spaces and measuring the strengths of observed relations by using a network analysis approach. As often outlined in literature ((Morten, 1999) , strong ties between people (people talking one to the other very often, working together, participating to the same projects) enable implementation and execution, whereas weak ties (people happening to meet at the coffee machine, at their desk, in the corridors or open-spaces) support the idea generation process.
By starting with the hypothesis that two people sharing spaces in the same building floor in the same day create a connection between them, a network of relations among colleagues has been outlined. The data model assumes that the strength of ties connecting two people proportionally depends on the reciprocal of the distance (in meters) between their two workstations.
In particular, in the algorithm used, strength is the force driving nodes closer one to each other.
First outcome
By using a standard force-directed layout algorithm, Force Atlas 2, we outlined a graphical visualization of connections: nodes represent people, ties represent collaboration/knowledge flows and nodes colors represent organizational departments (OpenKnowledge competence clusters).
In the graph below, nodes dimension is proportional to the number of days per week each person has attended the office. The closer the people averagely seated in the office during the period of analysis, the closer they are in the graph.
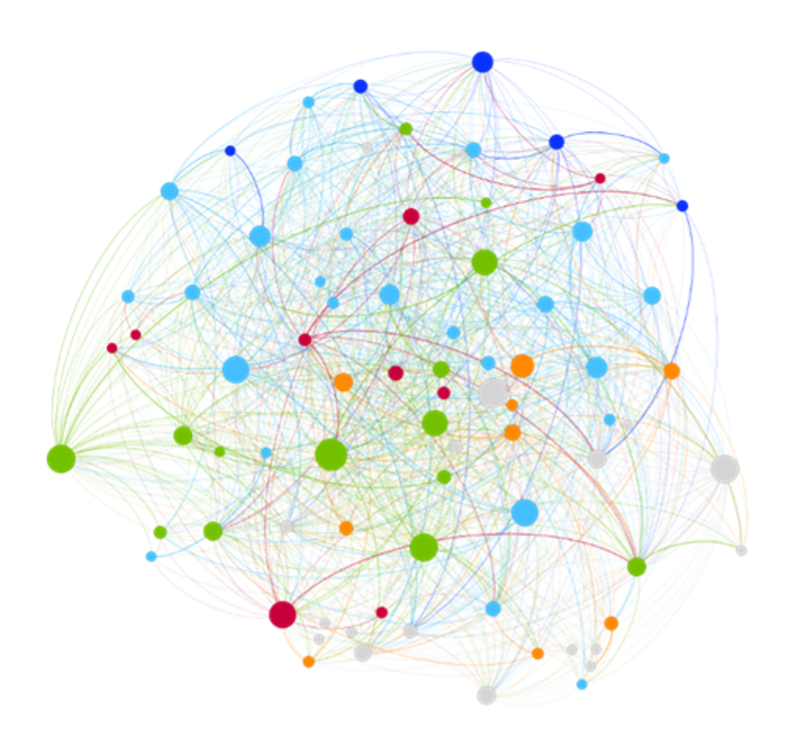
As a result, we obtained a complex and dense network (Figure 1) revealing multi-scale properties and a large amount of weak ties because of the initial data model assumption. The network highlights that there are some super-nodes (the biggest ones) which are deeply connected with most of the graph. This implies that some people used to come often to the office throughout the period and used to sit in places considered to be “central” in the network. Identically coloured nodes result to be not close: thus, a high proportion of relations is inter-department and the office is a suitable place for nurturing relationships.
However, in the network portrayed above, the capability of extracting interesting results is affected by the large amount of ties reflecting the digital footprints that people leave in the digital world: the larger the dataset, the noisier the resulting network; consequently, a further step was necessary to make the graph easier to read.
Noise and network backboning
Nowadays world is affected by noise, generated by traffic jams, conversations, people chatting and screaming around. Noise is also generated by huge amount of data, complex graphical visualization and overwhelming information. In a noisy world, extracting insights and taking decisions can be a harsh task.
To wrap up, the main issue faced in analyzing the network was to find a reliable filtering process, able to highlight critical information and to filter out noisy data preserving the graph properties (degree, edge weight and clustering coefficient distributions). As mentioned in the beginning of this article, strong ties and weak ties have two relevant (and different) meanings, and filtering out by using the ties’ weight would have brought to a loss of insights. Thus, the method followed was the network backboning process, developed in 2008 academics Serrano, Boguna and Vespignani. The algorithm’s result is “preserving structural properties and hierarchy at all scales” (Serrano et alii, 2009 ): briefly, network backboning aims at preserving only ties which are structurally representative of the network, discarding all those ties that can be found in a random network at a determined probability level.
In order to initialize the algorithm, we set an α probability-parameter (spanning from 0 to 1). The parameter α is a discretional threshold value of compatibility of each link weight against a random network scenario: if the compatibility is higher than a the link is discarded, otherwise preserved. The charts reported below display how degree, edge weight and clustering coefficient distributions vary alongside the variation of α in Python-generated scenarios [1].
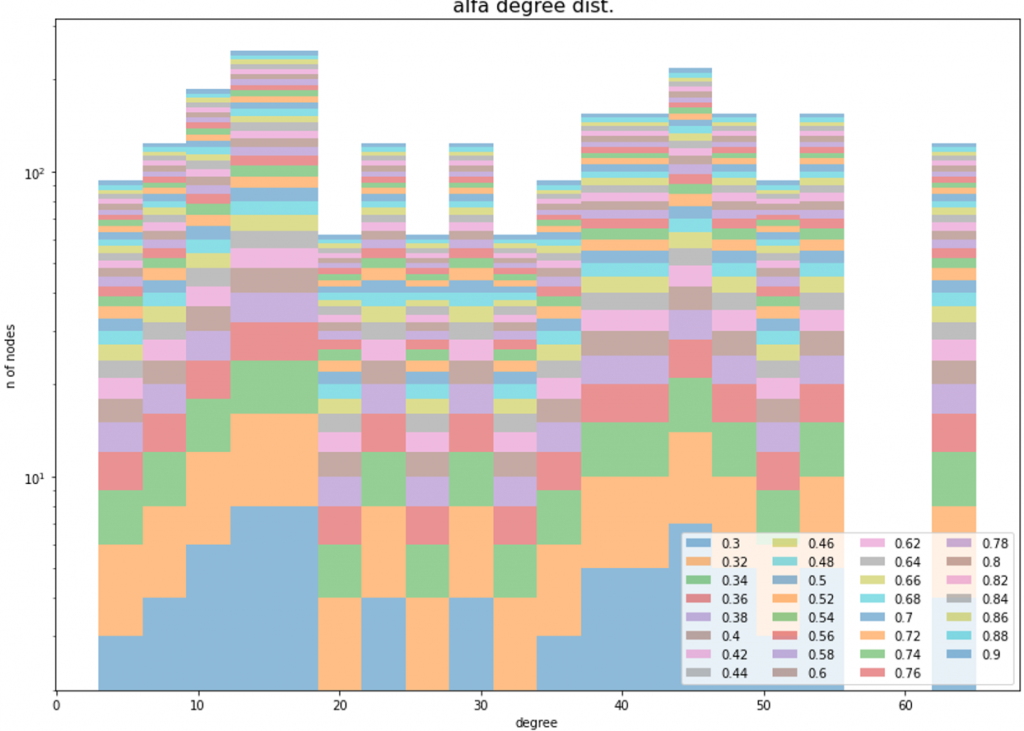
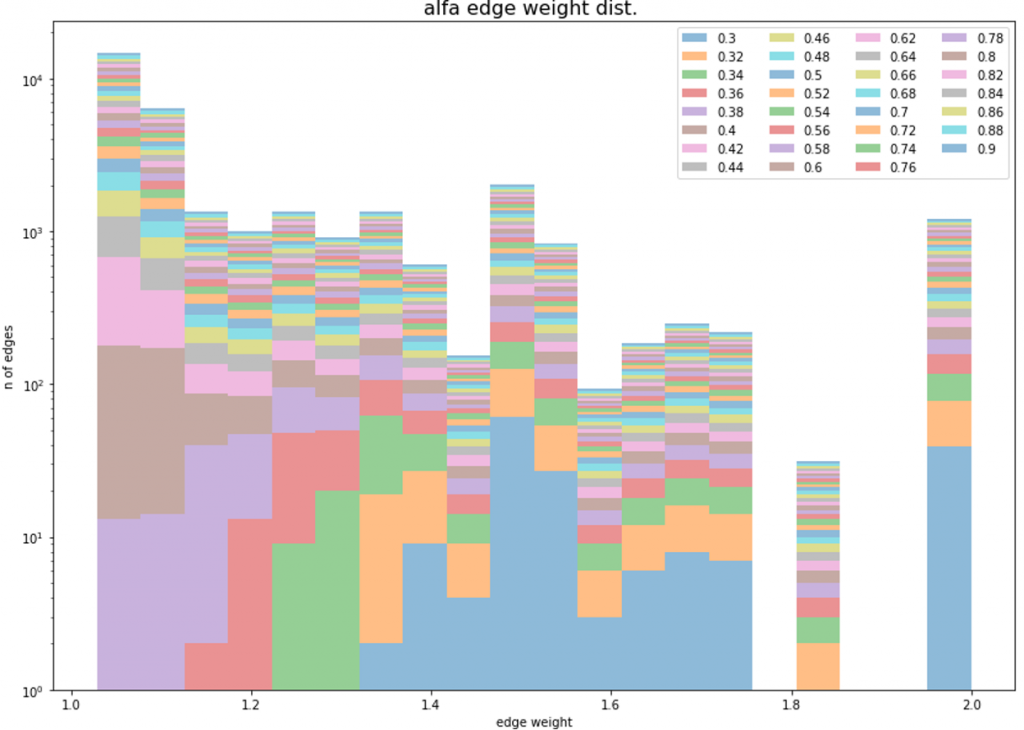
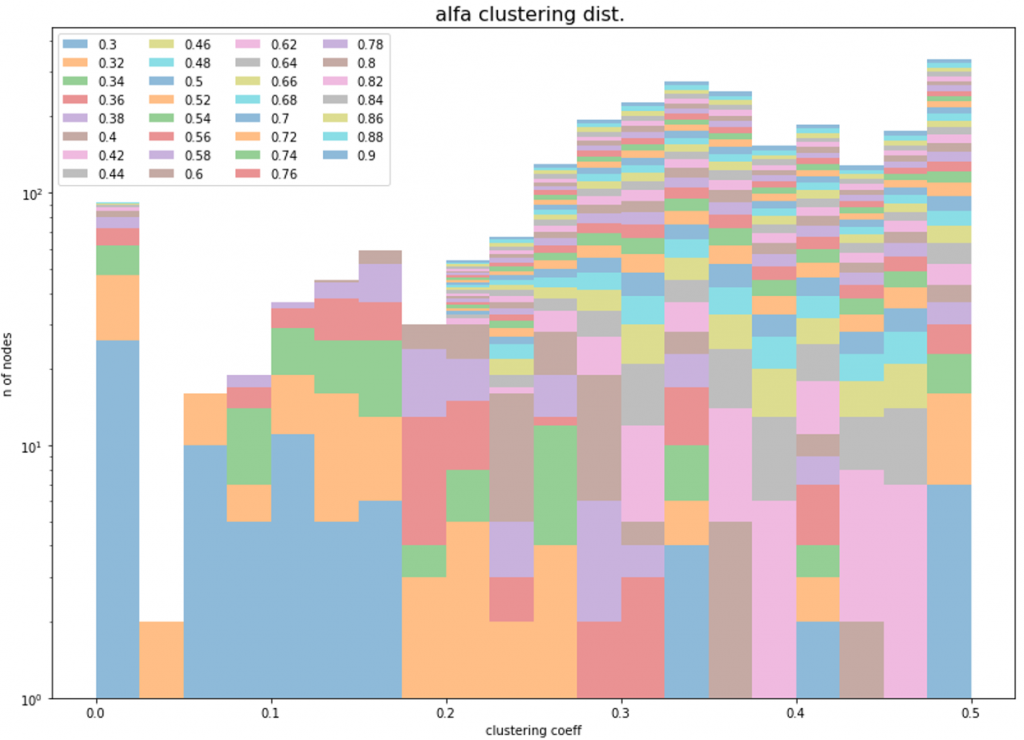
Figure 2: Distributions of nodes’ degree, edge weight and clustering coefficient with different α values
Following these evidences, α was set equal to 0.38 since it allowed to: prune the majority of ties; keep degree distribution, edge weight distribution and clustering coefficient distribution unaltered; make the network more readable.
[1] For the α-scenarios we used the Python package that may be found here on GitHub https://github.com/aekpalakorn/python-backbone-network/blob/master/backbone.py
Final resulting network
The following picture presents the final network obtained applying the network backboning filter with a value of α equal to 0.38.
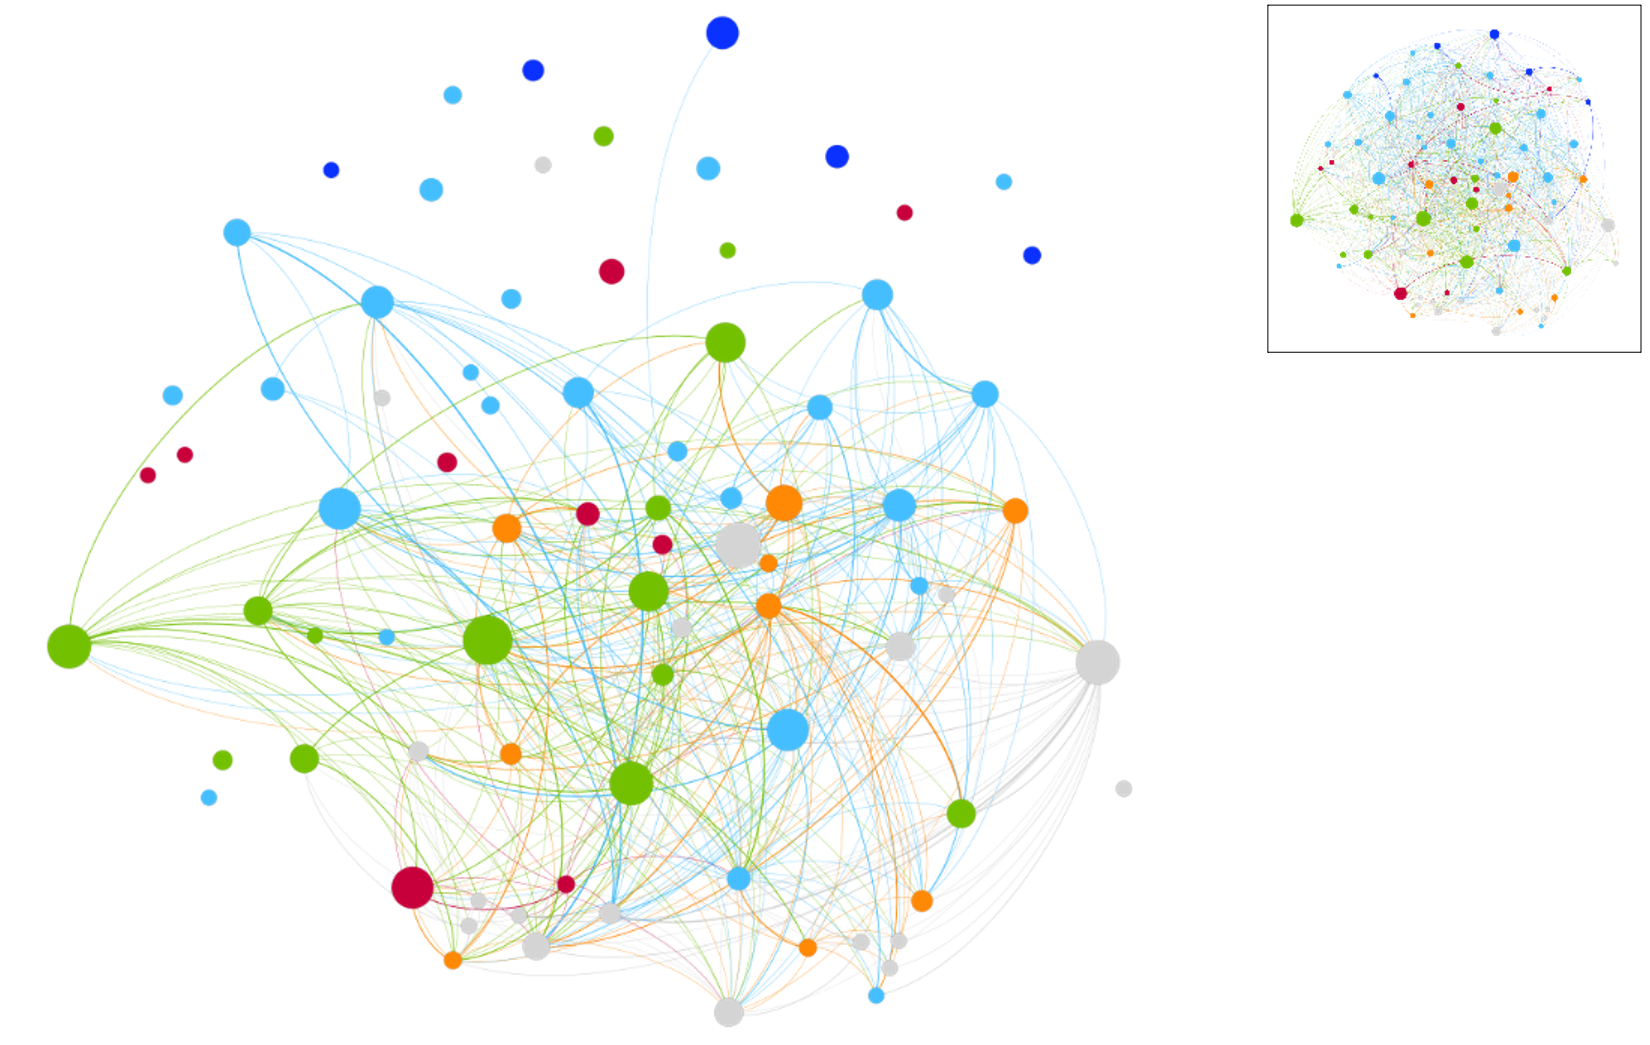
In the final graph, 53 nodes out of 86 (61%) are still connected: this represents the backbone of the original network. Here below we report our main findings:
- Two big nodes result to be rather isolate: the green node on the left side of the graph and the grey one on the right side; these nodes are regular visitors to the office, but accustomed to sit alone in desks far from the majority of other attendees.
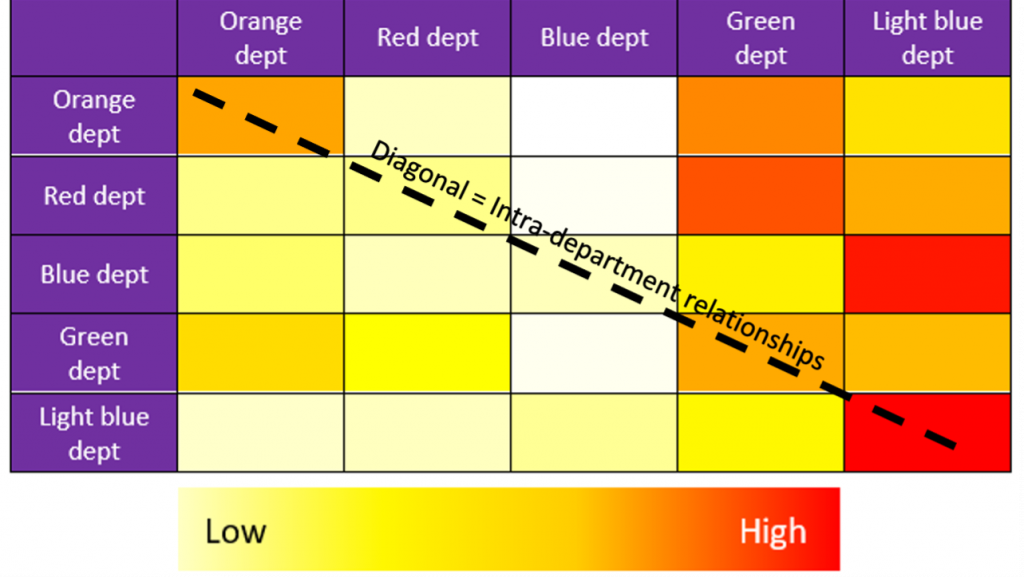
- Two departments emerge as core of significant ties: the light blue and the green ones; on a further inquiry, it resulted that colleagues from these departments tend to schedule together the office attendance. A further analysis has been carried out to investigate the proportion of ties intra and inter-department (Table 1). Results show that the majority of relationships of each department (see darker cells in the heatmap) are with other departments, except for the light blue department.
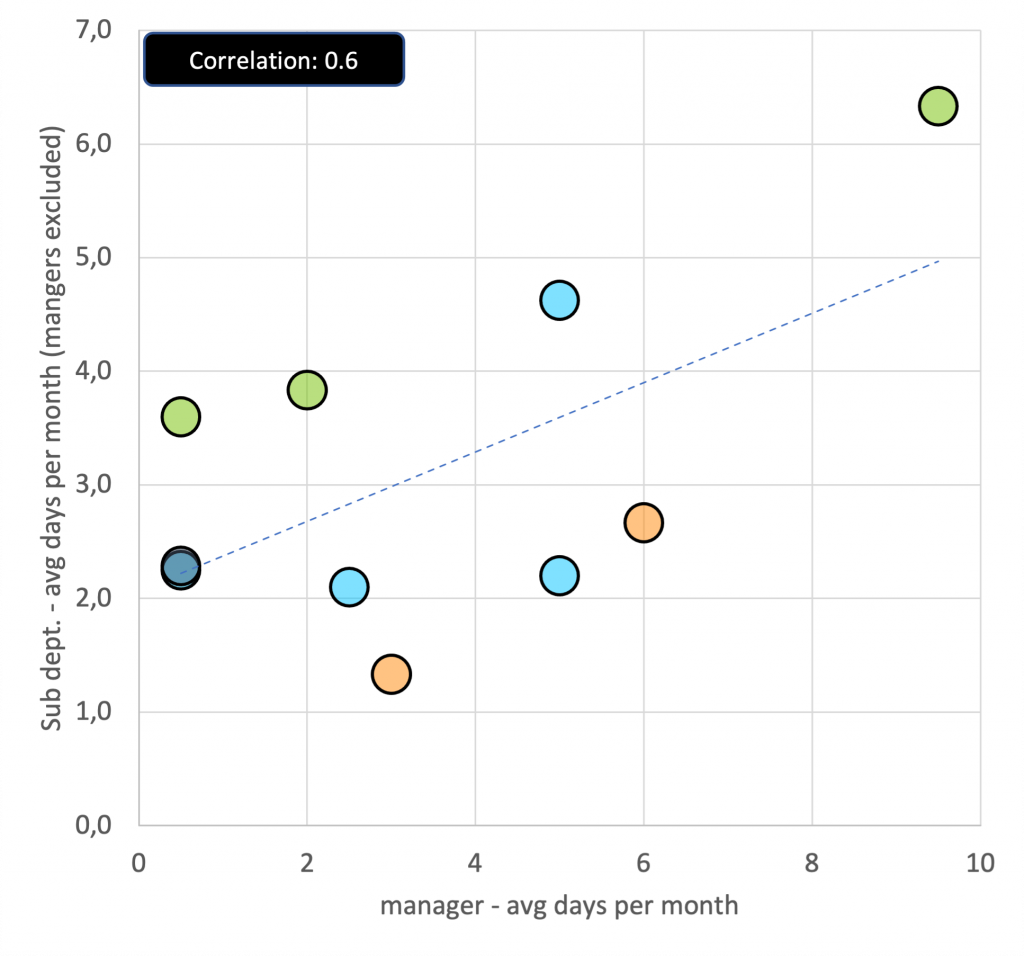
- Managers and senior level partners who attend the office tend to have many strong bonds. Moreover, a positive correlation between managers’ and the relative teammates’ attendance suggests that people tend to go to the office when their direct responsible is present (Table 2).
So what
Leaving employees free to decide whether to attend the office or not does not lead to empty office spaces: it gives more opportunities to improve work-life balance and it fosters weak ties creation by increasing casual meetings occasions. This component of fortuity contributes to break down silos, while in a fully remote work scenario people tend to talk every day with the same colleagues to which they are bound by relationships of friendship or collaboration in the same projects. Thus, fortuity enhances weak ties creation and the exchange of knowledge and ideas, in opposition to regular routines, fixed office desk assignment, and rigidly managed rules of attendance. However, many colleagues schedule with their teammates the day to attend the office together (see strongly tied departments in the graph above).
Employees know better than anyone else what is good for their daily work life and wellbeing. At the same time, companies need their employees to create value and innovation: providing a place where each person feels a belonging and opportunities for casual encounters may be the way to achieve a win-win situation. This solution may start the engine of innovation after two years of uncertainty and detachment.
Bibliography
Sica R. (2021), Introduzione, in Il tempo ritrovato, inserto redazionale di HBR Italia, December 2021, p. 7, our translation.
Morten T. H. (1999), The Search-Transfer Problem: The Role of Weak Ties in Sharing Knowledge across Organization Subunit, in Administrative Science Quarterly, 44, 1999, pp. 82-111.
Serrano M. A., Boguñáb M, Vespignani A. (2009), Extracting the multiscale backbone of complex weighted networks, in PNAS, April 2009, vol. 106, no. 16, p. 6483
Authors: Francesca Guzzetti, Adriano Cecconi, Federico Dottori